 |
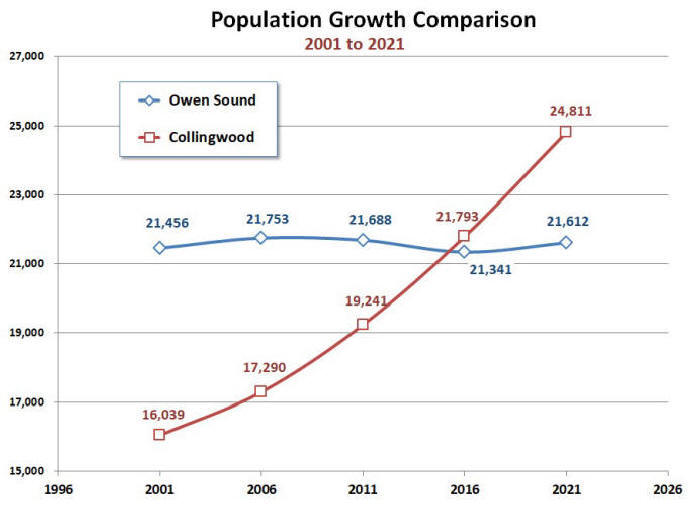
| Figure 1; Comparing Population Changes source: Statistics Canada |
One question
that many who have read my analysis of Owen Sound’s current
financial situation is:
“So our city has fallen on hard times, but haven’t all municipalities been
struggling?”. To answer this question we really need to compare our city to
similarly sized communities in our area. The best candidate that I found for
this comparison is the Town of Collingwood which is located just one hour to our
East.
|
|
| Figure 1; Comparing Population Changes source: Statistics Canada |
The census is taken every five years and the results are available on the Statistics Canada website which makes if very easy for anyone to access. The first thing that we notice when we compare populations, is that in 2001 Owen Sound’s population was actually 5,417 residents greater than Collingwood; but 20 years later in 2021, Collingwood was 3,199 residents greater than Owen Sound. During this period Collingwood grew by 54.69%, while Owen Sound grew by less than one percent - 0.73%.
BMA Consulting Inc. prepares annual reports on a number of aspects of municipal governments. Municipalities that subscribe to their services receive detailed annual reports on their performance. These reports are available for anyone to access, and are usually posted on municipal websites. I relied on these BMA reports, in addition to data compiled by Statistics Canada and the audited financials for each municipality, to complete this comparison.
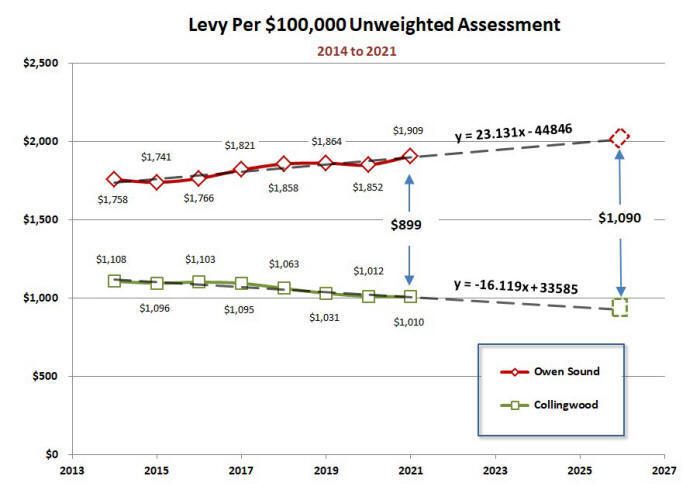 |
| Figure 2; Comparing Tax Revenue Changes source: BMA Municipal Studies |
The graph above shows the changes in tax revenue for both municipalities from
2014 to 2021. The first thing that pops out at you is that Owen Sound’s revenue
from taxation appears significantly higher than that for Collingwood. However,
this graph is displaying the tax revenue for each $100,000 of assessment. So,
unless the two municipalities have the same total value of assessment it doesn’t
really tell whole story. As we will see later Collingwood and Owen Sound do not
have the same total property value or assessment.
The feature that is most important about this graph is the direction that each
municipality’s taxation is headed. It is obvious that each year Collingwood is
relying on less and less revenue from taxation. So, it’s either reducing its
overall expenses, growing its assessment or growing revenue from sources other
than taxation. Owen Sound on the other hand is headed in the opposite direction.
In contrast to Collingwood, Owen Sound’s dependency on revenue from taxation is
increasing each year. This means that the burden on Taxpayers in Collingwood is
getting lighter each year; while the burden on Owen Sound taxpayers is getting
heavier each year.
The question is; Can Owen Sound residents continue to shoulder an increasingly
growing tax burden? To get a feeling for the ability of Owen Sound residents to
absorb tax increase we need to see how our household incomes compare to others.
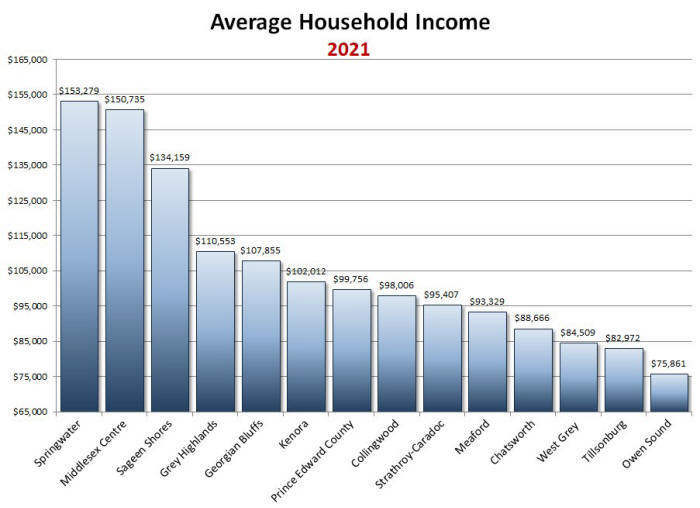 |
| Figure 3; Average Household Income of Similar Municipalities source: BMA Municipal Studies |
The graph above shows the average household incomes, in 2021, for a few similarly sized municipalities as well as our neighbours next door. You can easily see that incomes in Owen Sound are significantly lower than the similarly sized municipalities. Surprisingly household incomes are also much lower than Georgian Bluffs and Meaford. This really means that Owen Sound residents are the least able to absorb tax increases. Unfortunately, as we saw before, we are already the highest taxed community in Southern Ontario and things are getting worse. Collingwood is not shown because it was not included in the 2021 BMA data for this category.
To really understand what this means for Owen Sound residents we will now look at what percentage of our incomes that we have to spend on taxes compared to Collingwood.
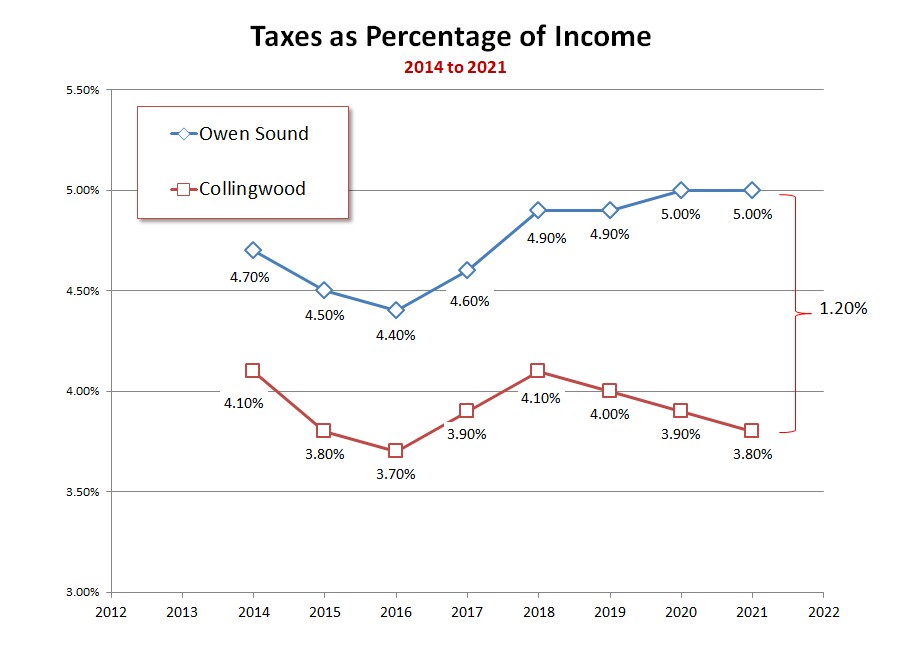 |
| Figure 4; Comparing Taxes as a Percentage of Income source: BMA Municipal Studies |
As you probably guessed things get even worse when we compare taxes as a percentage of median household income. As shown in the above graph a homeowner in Owen Sound in 2021 paid 1.2% more of their income than they would have paid had they lived in Collingwood. To put this in perspective 1.2% of the average household income of $75,861, is $910. This is within about 1% of the $899 shown on the previous graph, figure 2, that was calculated from the unweighted assessment. This gives us a high degree of confidence in both of these graphs since they were calculated using different criteria.
______________
In Part II we will compare Total Assessment and
take
a look at how we compare when it comes to
Salaries & Benefits