Excessive Growth in City Budgets – Part II
 My previous articles on taxation during the period 2011 to 2020, were based on
the city’s Audited Financial Statements available on the city’s website. The
Audited Financial Statements give us a high level of confidence. However, as
currently constructed they do not provide sufficient visibility for us to see
how individual department budgets are growing. For example, the audited
financials show us statements for “Recreation and Cultural Services”
which includes the Library, the Art Gallery, the Bayshore and the Rec Centre.
However, the city’s audited financial statements are currently structured to
show only groups of departments, so the Rec Centre for example is lumped in with
the Library, the Art Centre and the Bayshore under the heading of “Recreation
and Cultural Services”. Therefore we have no idea how any of these
individual departments performed during the study period. Perhaps the city will
change this to give taxpayers more visibility in the future.
My previous articles on taxation during the period 2011 to 2020, were based on
the city’s Audited Financial Statements available on the city’s website. The
Audited Financial Statements give us a high level of confidence. However, as
currently constructed they do not provide sufficient visibility for us to see
how individual department budgets are growing. For example, the audited
financials show us statements for “Recreation and Cultural Services”
which includes the Library, the Art Gallery, the Bayshore and the Rec Centre.
However, the city’s audited financial statements are currently structured to
show only groups of departments, so the Rec Centre for example is lumped in with
the Library, the Art Centre and the Bayshore under the heading of “Recreation
and Cultural Services”. Therefore we have no idea how any of these
individual departments performed during the study period. Perhaps the city will
change this to give taxpayers more visibility in the future.
The city does have some information on their website for some departments. I was
able to use these to gain some insight into a few departments and it appears
that the rapid growth in budgets is extreme for some departments. For example, I
was able to compile sufficient data on the Art Gallery, to construct the graph
below. I also found a couple examples of extreme growth in the 2022 budget that
I will discuss later.
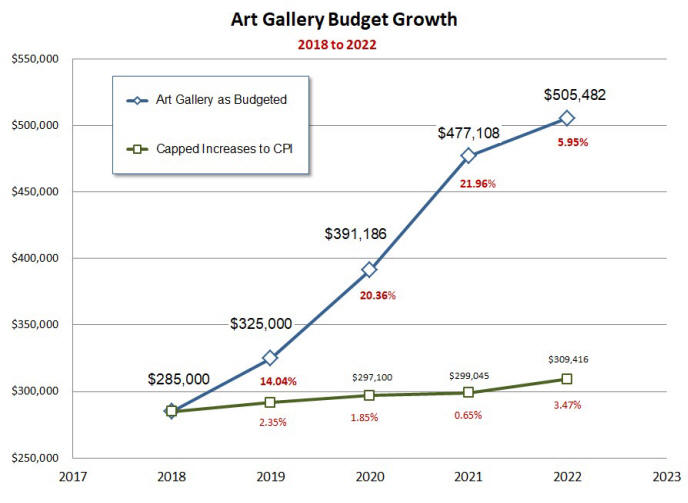
The graph above shows the operational budget for Art Centre for a five year
period from 2018 to 2022. We can see in this graph that the Art Gallery’s burden
to taxpayers, during this five year period, actually grew by $220,482 or 77.3 %.
This rapid growth becomes very obvious when plotted alongside the budget that
would have occurred had expenses been capped at the rate of increase for CPI,
shown in the above graph as a green line. This is highly irregular for a public
institution, especially since two of these years occurred during COVID lockdowns
during which time the Gallery was closed to the public. We also see that the Art
Gallery’s burden to taxpayers experienced double digit growth during this
period. Surprisingly in two of these years, 2020 and 2021 the growth exceeded
20% per year.
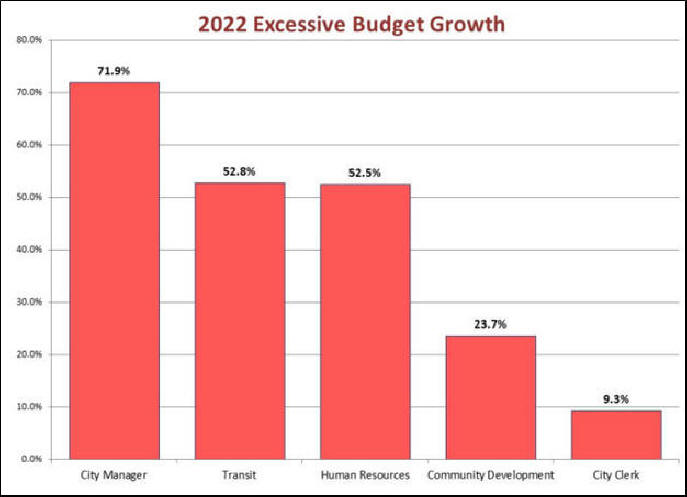
After reviewing the excessive growth that occurred in the Art Gallery I
thought I should take a quick look at the growth of other departments as
reported in the 2022 Budget. In the 2022 budget, there were 5 areas that had
extreme budget growth in excess of 9%. The City Manager’s Office experienced the
greatest growth on a percentage basis of 71.9%. This was followed closely by
Transit which grew by 52.8%. Human Resources grew by 52.5%. Community
Development grew by 23.7% and the Clerk’s office grew by 9.3%. As for the 71.9%
increase in the City Manager’s Office – it seems excessive and given the times
we are in Council should not have been approved this increase
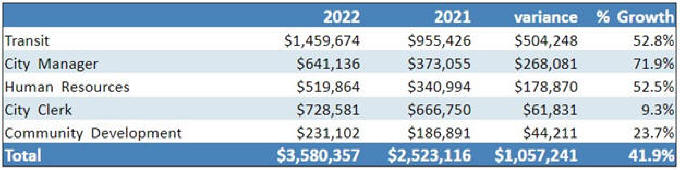
Above numbers are from the Final-Reduced Budget posted on the city’s
website
source:
2022 Budget:
https://www.owensound.ca/en/city-hall/resources/Documents/Consolidated-Budget-Book---Final-Reduced.pdf
In spite of the 2022 department budget statements at the above link being
labeled "Final-Reduced", these numbers differ from those in the 2022 Tally
Sheets shown in this document. The Tally Sheets show: Transit growth at $515,518
or 54.0%; City Manager budget growth at $158,081 or 42.4%; HR at 119,772 or
35.1%; City Clerk budget growth at $70,756 or 10.6%; and Community Development
at $16,386 or 8.8%. I’m guessing that these are actually the reduced numbers and
that staff forgot to change the individual department budgets to reflect the
reduction. Regardless of which numbers are correct, the department statements or
the Tally Sheets, these are absolutely huge increases for a single budget year
and should not have been approved by Council
Return to Top